
Description
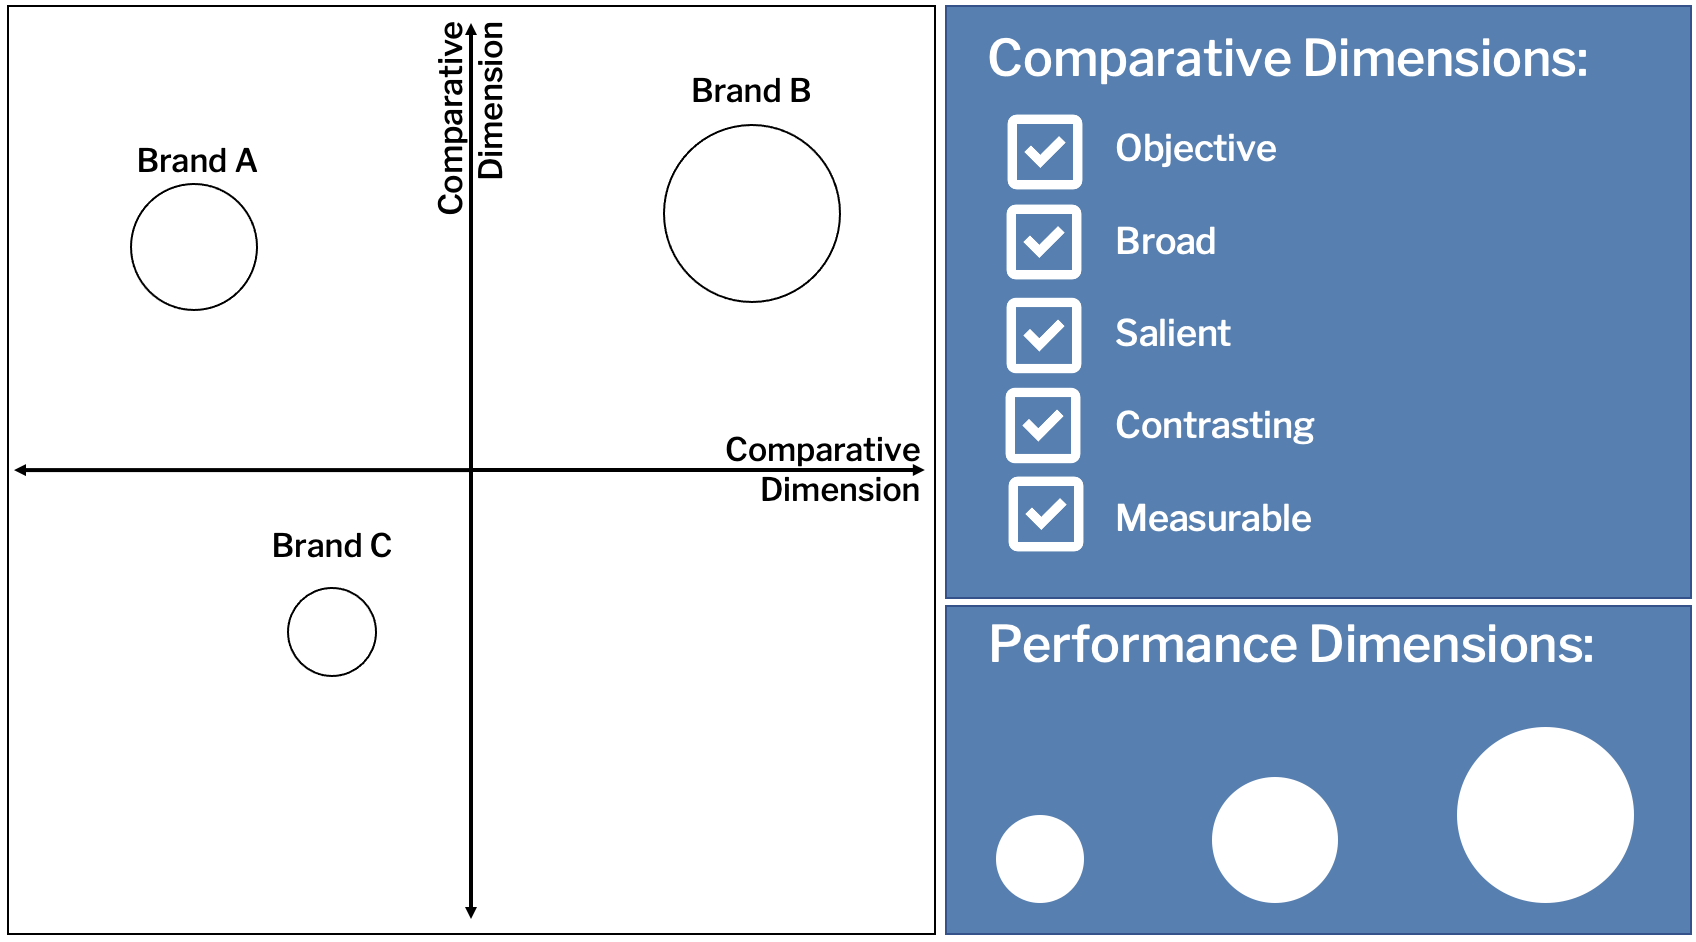
The purpose of a Brand Positioning Matrix is to measure and visualize differences among competing brands across relevant dimensions. These frameworks are often used in brand strategy work and can be presented in different formats. The format used most often is a matrix that illustrates competitive differences against two axes. Often, axes are chosen to ‘lead the witness’ by dramatizing a particular whitespace for positioning a brand. To avoid this pitfall (or temptation), make sure that the comparative dimensions for your axes are: (1) Broad: must be able to apply across all brands, (2) Salient: must matter to how customers distinguish brands, (3) Contrasting: must be perceived as polar opposites, (4) Measurable: must be able to place on a single axis, (5) Objective: must not be inherently good or bad.
Questions
The Brand Positioning Matrix helps to answer marketing questions like:
How are brands positioned in the market today?
What brands have a similar positioning to our brand?
Where is whitespace for brands in the market today?
Steps
Define the market that you are analyzing. This may be done traditionally, by organizing the matrix around existing competitors (e.g. basketball apparel). It may done more abstractly, by framing the matrix based on peripheral or non-traditional competitors (e.g. youth brands).
Based on how you have defined the market, identify the brands that meet your criteria and are relevant to how you will use the completed matrix. Only include brands that are relevant to your customers.
Identify the most meaningful comparative dimensions to include as axes. Consider all dimensions that are meaningful to how your customers differentiate and choose brands.
Measure each brand based on its relative position against each dimension. This should be informed by current customer research (not hunches) to be current and to avoid bias.
Map each brand to its corresponding position on the matrix format you are using.
Considerations
Use formats like spider graphs to analyze and plot brands using more than two dimensions
Use the same matrix over time to measure changes in brand perception and competitor actions
Use different sized ‘bubbles’ or brand names to visualize additional data layers (e.g. market share) per brand
References
Reis, Al. Trout, Jack. Positioning: The Battle for Your Mind. McGraw-Hill, 2001.