
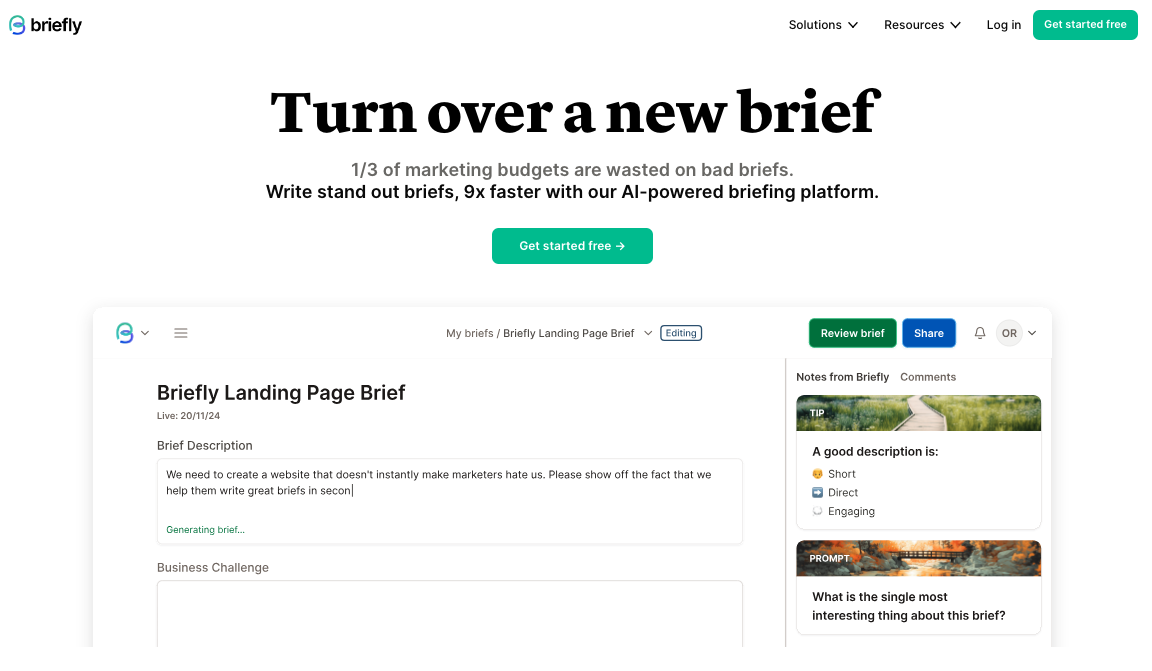
Most of the popular use cases for generative AI in marketing today involve producing creative assets efficiently at scale. But how can AI help with marketing planning? Tom Roach recently shared how his agency is using AI today, including examples of using a model for customer segmentation. He also highlights a new tool called Briefly that promises to help create marketing briefs using AI (and you thought copywriters were the only ones worried about their agency jobs?!) - I’m on the waiting list.
Microsoft recently released the New Future of Work Report that focuses on the impact of AI on different modes of work. One concept that is relevant to marketing planning is their reframing of LLM tools as ‘‘provocateurs” that promote critical thinking vs. “co-pilots” for basic, repetitive tasks (see page 9). A “provocateur” AI system (or use of system) would challenge assumptions and offer counterarguments - potentially helpful for upstream strategic planning.
I continue to monkey around with different AI tools to try and better understand the technology and its potential applications. One AI use case that is relevant for research and planning is classification: organizing data for better understanding. I came across a cool GPT called Diagrams: Show Me that classifies and visualizes information into diagrams, like mind-maps. It’s a simple example of how AI might help a planner to organize, present, and see new patterns in a data set. For example, since yesterday was the NBA trade deadline, and now there is no one left from my beloved 2019 NBA Champion Toronto Raptors on the team (no offence Chris Boucher!) I tried a few Raptor-focused prompts using the tool. It was interesting to see how the model interpreted more qualitative categories like, well, "organize by quality".

It will be interesting to see if / how these bespoke GPTs and AI tools gain traction. It feels like most of these will become features integrated within larger products and platforms. Below are a few new AI features launched recently by the big guys:
Amazon Shopping Companion: Amazon has launched a new chatbot called Rufus that will answer questions about products, make comparisons, provide suggestions.
Google Maps AI: In a similar vein, Google is rolling out an AI-powered feature within maps that provides users with recommendations based largely on input from its 300 million contributors.
Gemini & Google Ads: Google will use its new AI model (Gemini) to help people to create and manage Google Ad campaigns using conversational prompts, which could make Google Ads more accessible to small businesses and DIY marketers.
Fresh Research & Reports
Digital 2024 (We Are Social): The mother of all digital trends deck has arrived! 561 slides that cover how the world is connecting and using digital media and technology. Watch a 10-minute recap here.
The Future 100 2024 (VML): Another doozy of a deck includes 100 trends. A smart, fun variety of different themes and innovations are covered (from ‘psychedelic concierges’ to ‘operatic escapism’).
The META Trending Trends 2024 (Matt Klein): Annual meta-analysis that analyzes trends published across 70+ global cultural forecasts and synthesizes them into 14 themes (or ‘trending trends’).
LinkedIn Algorithm Insights (Just Connecting): If you’re looking to generate more reach and engagement for your LinkedIn activity, this is a great resource that charts how LinkedIn is changing and what you can do about it.
2024 Edelman Trust Barometer: Annual study asking ‘who do you trust’? Findings show people are split on acceptance of AI – a key factor being the level of trust in parties regulating the technology.
American’s Social Media Use (Pew): Fresh data on how different groups use social platforms – no big surprises, but a good reminder of how different the ages of users are of different platforms (e.g., Instagram vs. Facebook).
Brands! Visual Capitalist illustrates the most valuable brands in the world (revenue X brand strength). While less data driven, The Brand Yearbook is a smart / fun perspective on the most relevant brands for Gen Z.
Shaping Thinking
Last year, I put together a quasi-periodic table of visual elements that can be used to help bring more clarity to presentations. Each box includes what I want to communicate (the client’s question that I want to answer) and a visual element to help me do so. As a trainer and consultant, I find that incorporating the right visuals into a presentation or workshop can help me explain things more clearly, structure sessions more effectively, direct the attention of participants, and ultimately influence outputs. If you’re looking for frameworks top help shape thinking, check out the Kickframe Toolbox with over 55 editable templates to download :-)
